Difference between revisions of "Map"
Jump to navigation
Jump to search
(→Creating a Map) |
|||
| Line 18: | Line 18: | ||
***Select ‘Color to Alpha’ from the colors menu to change the selected area into a transparent part of the image | ***Select ‘Color to Alpha’ from the colors menu to change the selected area into a transparent part of the image | ||
***Export the image as a .PNG file and save to your preferred location | ***Export the image as a .PNG file and save to your preferred location | ||
| − | ***Import the PNG file into LiveDC utilizing the “Uploaded Images” feature ( | + | ***Import the PNG file into LiveDC utilizing the “Uploaded Images” feature (see “Uploading an Image” for more information) |
[[File:Heatmap.png]] | [[File:Heatmap.png]] | ||
| Line 24: | Line 24: | ||
<ol> | <ol> | ||
<li>On the navigation menu (left-hand side) click “Visuals” and click “Maps” this will open a new tab titled “Maps”</li> | <li>On the navigation menu (left-hand side) click “Visuals” and click “Maps” this will open a new tab titled “Maps”</li> | ||
| − | <li>Within the | + | <li>Within the maps tab (upper left-hand corner) click the “Create” button. A new window will open up called “Create Map.”</li> |
<ol type="a"> | <ol type="a"> | ||
| − | <li>Enter the name of the | + | <li>Enter the name of the map in the “Name” field</li> |
<ol type="i"> | <ol type="i"> | ||
<li>Examples: Operational Model – Cooling, Power %, Operational Cost per Cabinet, etc.</li> | <li>Examples: Operational Model – Cooling, Power %, Operational Cost per Cabinet, etc.</li> | ||
</ol> | </ol> | ||
| − | <li>Enter any additional information about the | + | <li>Enter any additional information about the map in the “Details” field</li> |
| − | <li>Define a horizontal size in pixels for the | + | <li>Define a horizontal size in pixels for the map in the “Width” field</li> |
<ol type="i"> | <ol type="i"> | ||
| − | <li>A good rule of thumb is to look at the | + | <li>A good rule of thumb is to look at the properties of the image and use those predefined dimensions (usually no more than 1650 pixels)</li> |
<ol type="A"> | <ol type="A"> | ||
<li>If you have an image larger than that, you can scale the image down to a smaller size before importing</li> | <li>If you have an image larger than that, you can scale the image down to a smaller size before importing</li> | ||
| Line 39: | Line 39: | ||
</ol> | </ol> | ||
</ol> | </ol> | ||
| − | <li>Define a vertical size in pixels for the | + | <li>Define a vertical size in pixels for the map in the “Height” field</li> |
<ol type="i"> | <ol type="i"> | ||
| − | <li>A good rule of thumb is to look at the | + | <li>A good rule of thumb is to look at the properties of the image and use those predefined dimensions (usually no more than 1300 pixels)</li> |
<ol type="A"> | <ol type="A"> | ||
<li>If you have an image larger than that, you can scale the image down to a smaller size before importing</li> | <li>If you have an image larger than that, you can scale the image down to a smaller size before importing</li> | ||
| Line 47: | Line 47: | ||
</ol> | </ol> | ||
</ol> | </ol> | ||
| − | <li>Add a | + | <li>Add a legend to the map in the section titled “Legends” by selecting from the drop down menu and clicking the left-hand facing arrow or create a new “Legend” record by clicking the star button (see [[Extras#Creating a Legend|Creating a Legend]] section for instructions)</li> |
[[File:Legend.png]] | [[File:Legend.png]] | ||
| − | <li>Add | + | <li>Add layers to the map in the section titled “Layers” by selecting from the drop down menu and clicking the left-hand facing arrow or create a new “Layer” record by clicking the star button (see [[Extras#Creating a Layer|Creating a Layer]] section for instructions)</li> |
[[File:Layer.png]] | [[File:Layer.png]] | ||
<li>Click “Create”</li> | <li>Click “Create”</li> | ||
| − | <li>The next step is to add a data series/influence to the | + | <li>The next step is to add a data series/influence to the map (see [[Extras#Creating an Influence|Creating an Influence]] section for instructions)</li> |
[[File:Heatmap-influence.png]] | [[File:Heatmap-influence.png]] | ||
</ol> | </ol> | ||
</ol> | </ol> | ||
Revision as of 07:17, 25 July 2014
Contents
Creating a Map
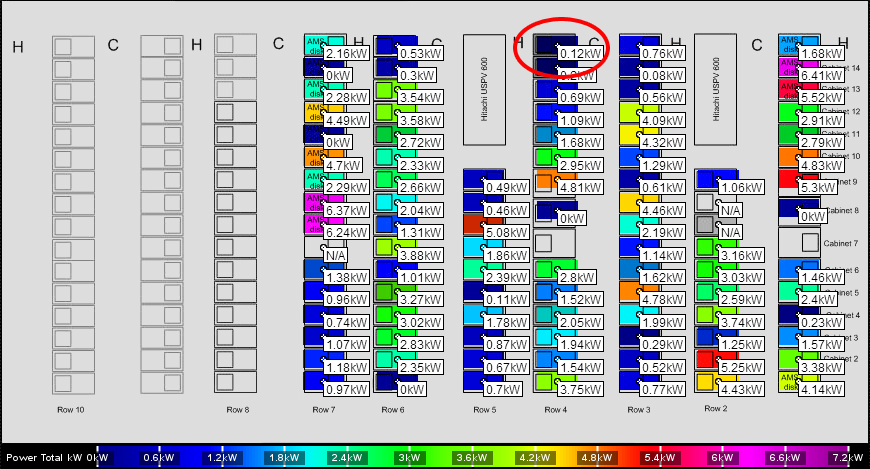
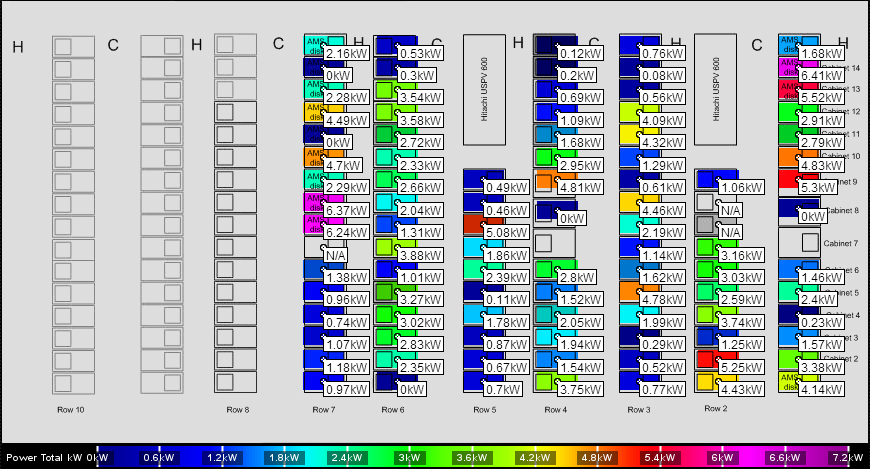
A map is a customizable representation of data where individual values contained in the visual are shown by colors. Fed by data series, a map can show many different types of data, such as power usage, temperature, humidity, etc. A map does not just need to be an image of your data center, you can place an influence on any transparent image uploaded into LiveDC. You will need to gather the following information prior to creating a map:
- Name of the map
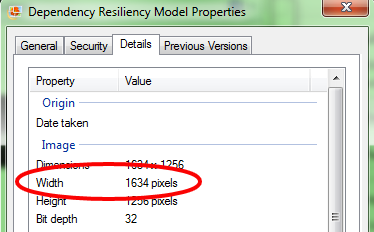
- Width in pixels of the map (determined by looking at the properties of the image)
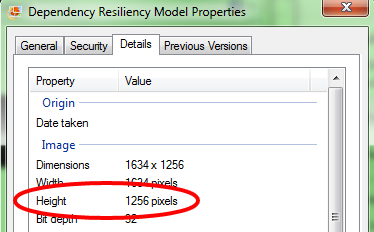
- Height in pixels of the map (determined by looking at the properties of the image)
- The legend that corresponds with the map (Temp, Humidity, Power, Cost, etc.)
- This is the representative color scale you see at the bottom of each map
- The layers that will make up your map (solid background, influences layer, transparent floor layout, etc.)
- Most maps are made of those three (3) layers
- A good way to make your floor layout transparent is to use an open source program called GIMP, which can be downloaded from the web
- Import the floor layout into GIMP
- Change all colors to “Gray scale” by selecting mode under the image menu
- Create a black border for the floor layout using the selection tool under the tools menu in GIMP
- Select ‘Color to Alpha’ from the colors menu to change the selected area into a transparent part of the image
- Export the image as a .PNG file and save to your preferred location
- Import the PNG file into LiveDC utilizing the “Uploaded Images” feature (see “Uploading an Image” for more information)
Instructions
- On the navigation menu (left-hand side) click “Visuals” and click “Maps” this will open a new tab titled “Maps”
- Within the maps tab (upper left-hand corner) click the “Create” button. A new window will open up called “Create Map.”
- Enter the name of the map in the “Name” field
- Examples: Operational Model – Cooling, Power %, Operational Cost per Cabinet, etc.
- Enter any additional information about the map in the “Details” field
- Define a horizontal size in pixels for the map in the “Width” field
- A good rule of thumb is to look at the properties of the image and use those predefined dimensions (usually no more than 1650 pixels)
- Define a vertical size in pixels for the map in the “Height” field
- A good rule of thumb is to look at the properties of the image and use those predefined dimensions (usually no more than 1300 pixels)
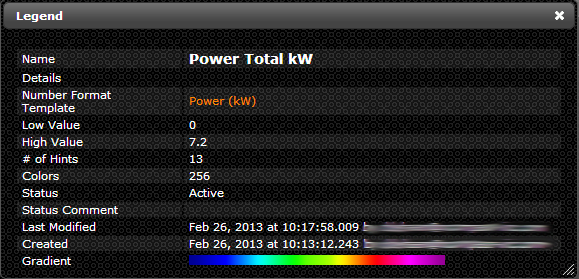
- Add a legend to the map in the section titled “Legends” by selecting from the drop down menu and clicking the left-hand facing arrow or create a new “Legend” record by clicking the star button (see Creating a Legend section for instructions)
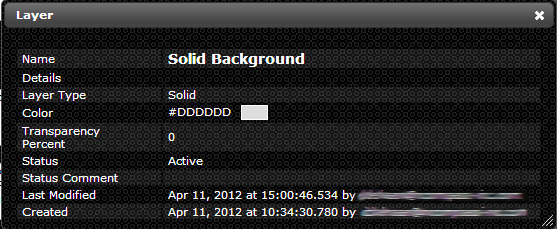
- Add layers to the map in the section titled “Layers” by selecting from the drop down menu and clicking the left-hand facing arrow or create a new “Layer” record by clicking the star button (see Creating a Layer section for instructions)
- Click “Create”
- The next step is to add a data series/influence to the map (see Creating an Influence section for instructions)
