Difference between revisions of "LiveTile"
Jump to navigation
Jump to search
Zkatzadmin (talk | contribs) (→Instructions) |
Zkatzadmin (talk | contribs) (→Instructions) |
||
| Line 50: | Line 50: | ||
[[File:Livetile 4.png|400px]] | [[File:Livetile 4.png|400px]] | ||
<li>Select the minimum amount to be shown in the LiveTile in the “Scale Min” drop-down menu or create a new “Scale Min” record by clicking the star button (see [[Create a Data Series#Creating a Data Series|Creating a Data Series]] section for instructions)</li> | <li>Select the minimum amount to be shown in the LiveTile in the “Scale Min” drop-down menu or create a new “Scale Min” record by clicking the star button (see [[Create a Data Series#Creating a Data Series|Creating a Data Series]] section for instructions)</li> | ||
| − | [[File: | + | [[File:Livetile 5.png|400px]] |
<li>Select the number format for which the minimum amount desired will be displayed in the “Format Override for Min” drop-down menu or create a new “Format Override for Min” record by clicking the star button (see [[Extras#Creating a Number Format Template|Creating a Number Format Tempalte]] section for instructions)</li> | <li>Select the number format for which the minimum amount desired will be displayed in the “Format Override for Min” drop-down menu or create a new “Format Override for Min” record by clicking the star button (see [[Extras#Creating a Number Format Template|Creating a Number Format Tempalte]] section for instructions)</li> | ||
</ol> | </ol> | ||
Revision as of 11:13, 22 April 2019
Contents
Creating a LiveTile
A LiveTile is a way to display executive level data regarding, but not limited to, power, space, and cooling. We see LiveTiles as a dashboard approach to visually display your data. You will choose the appropriate data series to show specific metrics within your LiveTile. These data series include:
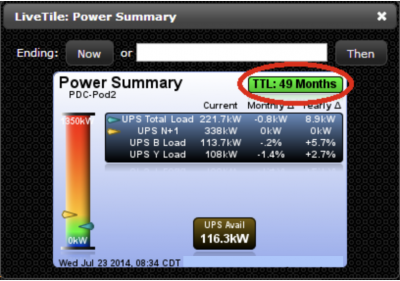
- Time to live – The remaining time before a certain resource has been used up, if it continues to grow at a steady rate
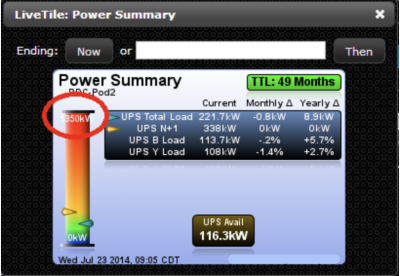
- Scale max – The maximum amount of the resource that you wish to display (maximum ports, maximum space, maximum power, etc.)
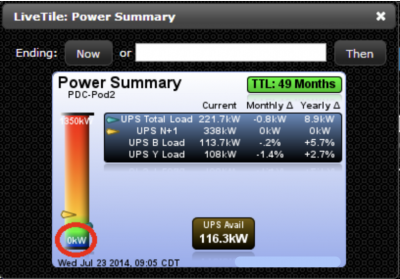
- Scale min – The minimum amount of the resource that you wish to display (minimum power, minimum space, etc.)
- Scale built – Typically for space tracking within the server cabinet. The amount of RUs built out for usage. In more generic terms, the amount of a resource that has been built out to be consumed
- Scale current – The amount of the resource that your data center is currently consuming or any other factor is currently consuming
- Format override for max – A number format template to change the suffix of a number in a data series to input into a LiveTile
- Example: 10 Amps to 1 kW, 23 to 23 RUs, etc.
- Format override for min – A number format template to change the suffix of a number in a data series to input into a LiveTile
- Example: 1 kW to 10 Amps, 30 to 30 RUs, etc.
Instructions
- On the navigation menu (left-hand side) click “Visuals” and then click “LiveTiles” and this will open a new tab titled “LiveTiles”
- Within the LiveTiles tab (upper left-hand corner) click the “Create” button. A new window will open up called “Create LiveTile.”
- Enter the following information under the “Basics” tab
- Enter the name of the LiveTile in the field titled “Name”
- Examples: CO2 Summary, Power Summary, PDU Summary, etc.
- Enter any additional information about the LiveTile in the “Details” field
- Enter the title of the LiveTile in the “Title” field
- Examples: Power Summary, Temperature Summary, etc.
- The title is what is displayed in the image as shown below
- Enter the subtitle of the LiveTile in the “Subtitle” field
- Examples: Room Name
- The subtitle is what is displayed below the title
- Select a time to live for the LiveTile in the “Time to Live” drop-down menu or create a new “Time to Live” record by clicking on the star button (see Creating a Data Series section for instructions)
- Enter an amount of time before the LiveTile will refresh itself in the “Refresh Time Period” section
- We typically set the refresh time to 1 hour as the values within the LiveTile are usually set to a 15 minute refresh time
- Enter the following information under the “Scale” tab
- Select the maximum amount to define in the LiveTile in the “Scale Max” drop-down menu or create a new “Scale Max” record by clicking the star button (see Creating a Data Series section for instructions)
- Select the number format for which the maximum amount desired will be displayed in the “Format Override for Max” drop-down menu or create a new “Format Override for Max” record by clicking the star button (see Creating a Number Format Template section for instructions)
- Select the built amount to define in the LiveTile in the “Scale Built” drop-down menu or create a new “Scale Built” record by clicking the star button (see Creating a Data Series section for instructions)
- Select the current amount to be shown in the LiveTile in the “Scale Current” drop-down menu or create a new “Scale Current” record by clicking the star button (see Creating a Data Series section for instructions)
- Select the minimum amount to be shown in the LiveTile in the “Scale Min” drop-down menu or create a new “Scale Min” record by clicking the star button (see Creating a Data Series section for instructions)
- Select the number format for which the minimum amount desired will be displayed in the “Format Override for Min” drop-down menu or create a new “Format Override for Min” record by clicking the star button (see Creating a Number Format Tempalte section for instructions)
- Enter the following information under the “Notes” tab
- Add notes to the LiveTile that will be visually displayed in the “Main Notes” section by selecting from the drop down menu and clicking the left-hand facing arrow or create a new “Main Notes” record by clicking the star button (see Creating a Data Series section for instructions)
- Add footnotes to the LiveTile that will be visually displayed in the “Foot Notes” section by selecting from the drop down menu and clicking the left-hand facing arrow or create a new “Foot Notes” record by clicking the star button (see Creating a Data Series section for instructions)
- Enter the following information under the “Values” tab
- Add “Highlights” desired to be called out in the LiveTile by clicking the star button to create a new “Highlights” record. In the “Create LiveTile Highlight” window enter the following information:
- Enter a name for the highlight in the “Name” field
- Examples: Ports Avail %, CO2 Year Total, UPS % Used, etc.
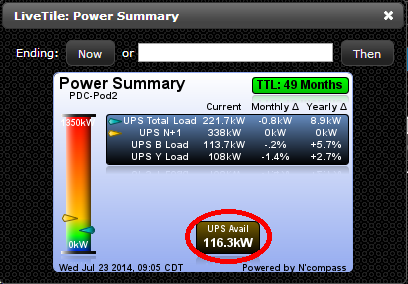
- Select a data series to use for the highlight from the drop down menu or create a new data series record by clicking the star button (see Creating a Data Series section for instructions))
- Select a “Format Override” to format the numbers in the highlight from the drop down menu or create a new “Format Override” record by clicking the star button (see Creating a Number Format Template section for instructions)
- Click “Add”
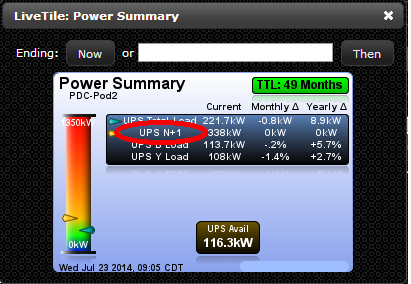
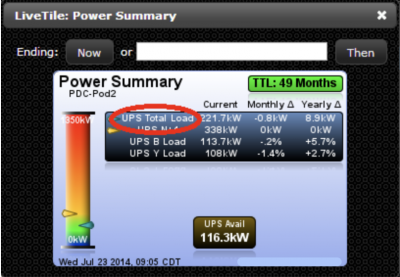
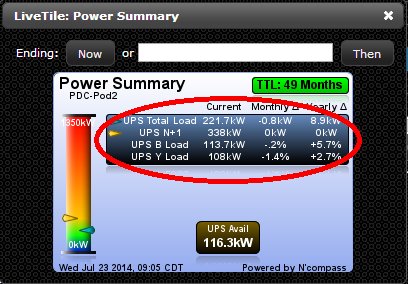
- Add entries to be displayed in the LiveTile in the “Table Entries” section by clicking the star button to create a new “Table Entry” record. In the “Create LiveTile Table Entry” enter the following:
- Enter the name of the table entry in the “Name” field
- Examples: UPS A Load, Total Load (Tons), Average Cold Aisle, etc
- Select a data series to be used for the table entry from the drop-down menu or create a new data series record by clicking the star button (see Creating a Data Series section for instructions)
- Select a “Format Override” to format the numbers in the table entry from the drop down menu or create a new “Format Override” record by clicking the star button (see Creating a Number Format Template section for instructions)
- Choose a way of comparing previous data with today’s data in the “Delta Comparison” drop-down menu
- Click "Add"
- Click “Create”
- You now have a LiveTile that will continue to update on the refresh interval time and be available at anytime for viewing.
